
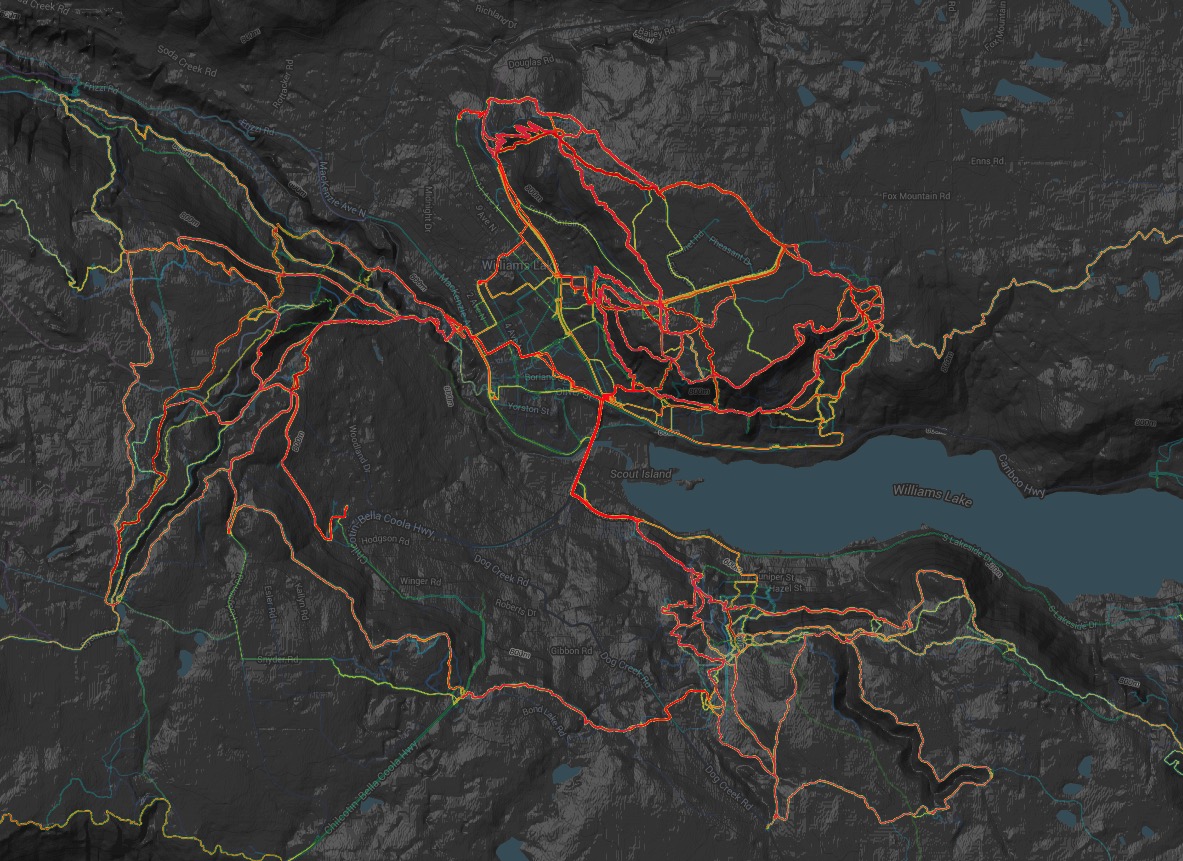
We here at the CMBC are big fans of Trailforks. One of the lesser known, cool features hidden in Trailforks is the POPULARITY HEATMAP, which will colour the trails based on a colour heatmap. The Trailforks  heatmap shows users ridelog data around the world.
- The range is green to yellow to orange to red. Green being the least ridden trail, red being the most.
- This popularity data is calculated based on users ridelog data from the past year and relative to only the trails in the same region.
The region is all trails in the same city. - Trails are ranked on a 1-100 scale based on how much they are ridden. A different green-red colour is assigned to every 5 steps in the 1-100 scale, so there will be up to 25 colours on the heatmap.
Check out your favourite trails and see how they stack up when it comes to trail usage:
Download the Trailforks Mountain Bike Trail App here:
Thomas Schoen